Introduction
Whether you are pitching to potential clients, delivering a keynote speech, or presenting quarterly results, a well-designed slide deck can make a significant difference. A well-designed slide deck can be a powerful tool for presenting information, persuading audiences, and closing deals. But simply throwing text and bullet points onto slides won’t cut it. To truly capture your audience’s attention and make your message memorable, you need to use data visualization effectively. Data visualization, when executed effectively, can turn a mundane presentation into a compelling narrative.
In today’s fast-paced world, audiences are bombarded with information, captivating your audience is more important than ever. They have limited time and attention spans, so it’s crucial to communicate your message clearly and concisely. This is where professional slide decks come in.
Here’s how using data visualization can elevate your slide deck and why partnering with a professional slide deck provider like Pipaani can make all the difference.
What is Data Visualization?
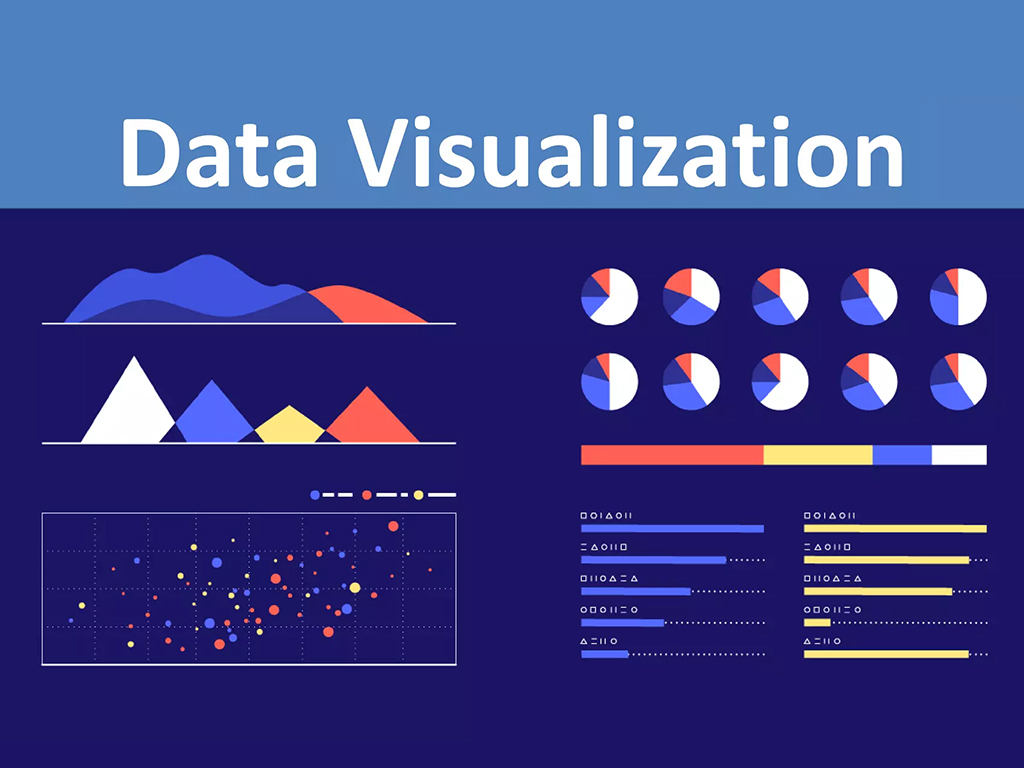
Data visualization is the practice of illustrating data through graphical formats. It uses charts, graphs, maps, and other visual elements to communicate complex data in a way that is easy to understand.
The Impact of Visualizing Data
Data visualization is more than just a design trend, it’s a powerful tool that can transform complex data into clear, engaging visuals. By converting raw numbers into charts, graphs, and infographics, you make information more accessible and easier to understand. This is particularly crucial when dealing with dense datasets that might otherwise overwhelm your audience.
Why Use Data Visualization in Your Slide Decks?

There are many reasons to use data visualization in your slide decks. Some of those are:-
- Data visualization is more engaging than text. People are visual learners, and they process information much faster from visuals than from text. By using data visualization, you can make your slides more engaging and interesting for your audience.
Visual elements are more engaging than text alone. Incorporating data visualization into your slide deck can keep your audience’s attention focused and make your presentation more memorable. Interactive visuals, such as clickable charts or animated graphs, can further increase engagement and provide a more dynamic viewing experience.
- Data visualization can help you tell a story. Data can be used to tell a compelling story about your business, product, or service. By using data visualization, you can help your audience connect with your message on an emotional level.
- Data visualization can make critical and complex data easier to comprehend and understand. A well-designed chart or graph can convey a wealth of information at a glance, helping your audience grasp key points without getting lost in a sea of numbers. For instance, instead of showing a lengthy list of financial metrics, a bar chart can quickly illustrate revenue growth over time, making your data more digestible and impactful. This is especially important if you are presenting data-heavy topics.
- Data visualization can help you make your point more persuasive. Data visualization can be a powerful tool for persuasion. By using data visualization, you can back up your claims with evidence and make your arguments more convincing.
- Data visualization can reveal crucial insights. Data visualization allows you to highlight key insights and trends that might be missed in a traditional text-heavy presentation. By using color, size, and positioning, you can draw attention to important data points and trends. This can be particularly effective in slide decks where you need to drive home specific messages or conclusions.
Tips for Using Data Visualization in Your Slide Decks
Now that you know why you should use data visualization in your slide decks, here are some tips for doing it effectively:
- Keep it short and simple. Don’t overload your slides with too much data or too many charts. Focus on the most important information and use visuals to highlight that information.
- Use clear and concise labels. Make sure your charts and graphs are easy to understand. Use clear and concise labels for your axes and data points.
- Choose the right chart type. There are many different types of charts and graphs available. Choose the chart type that is best suited for the data you are trying to represent.
- Use color effectively. Color can be a powerful tool for highlighting important information and making your visuals more engaging. However, it’s important to use color carefully. Steer clear of excessive or clashing colors.
- Use white space effectively. White space is the empty space between elements on your slides. It can help to improve the readability of your slides and make them more visually appealing.
- Use high-quality visuals. Ensure your visuals are clear, crisp, and professionally designed. Avoid using low-resolution images or blurry charts.
Examples of Effective Data Visualization in Slide Decks
Here are a few examples of how you can use data visualization to enhance your slide decks:
- Use a bar chart to show the growth of your business over time. Perfect for comparing values among different categories.
- Utilize a line chart to illustrate data trends. Best for showing trends over time.
- Use a pie chart to show the breakdown of a whole into its parts.
- Use a map to show the location of your customers or sales offices.
- Use an infographic to summarize complex information. Great for summarizing complex information in an engaging format. Go through our comprehensive blog, “Infographics: Designing Eye-Catching Visual Representations with Pipaani” and get more information and knowledge on infographics!
Selecting the right visuals ensures that your data is presented clearly and effectively, helping you convey your message without confusion.
The Significance of a Content Creation Agency
Creating effective data visualizations requires a keen eye for design and an understanding of how to present data in a meaningful way. This is where a content creation agency, like Pipaani, can play a pivotal role. A content creation agency specializes in crafting high-quality content that aligns with your brand’s goals and message. When it comes to slide decks, a professional content creation team can provide valuable expertise in creating visually appealing and informative presentations.
Pipaani’s Approach
Pipaani, known for its subscription-based content services, offers a comprehensive range of slide deck writing services that can enhance your presentations. Their monthly content creation packages ensure that you receive consistent and high-quality content tailored to your needs. By leveraging their expertise, you can create PowerPoint slide decks that not only look great but also effectively communicate your message through compelling data visualizations.
Explore our blog post, “Understanding Subscription-Based Content”, to get more information about Pipaani’s subscription-based content writing services!
Final Thought
Data visualization is a powerful tool that can enhance the effectiveness of your slide decks by making complex information more accessible and engaging. By using data visualization effectively, you can create professional slide decks that will capture your audience’s attention, make your message memorable, and help you achieve your goals.
Additional Tips
- If you are not a design pro, there are a number of tools available to help you create data visualizations for your slide decks. These tools include PowerPoint, Google Slides, and Canva.
- Consider using a subscription-based content creation service like Pipaani to create professional slide decks for you. Pipaani offers unlimited requests for content and design, as well as a 24-hour delivery option.
By partnering with a content creation agency like Pipaani, you can benefit from their expert slide decks writing services in creating professional slide decks that leverage data visualization to its fullest potential. Whether through monthly content creation packages or bespoke slide deck writing services, Pipaani helps ensure that your presentations are both visually appealing and impactful. Embrace the power of data visualization to captivate your audience and convey your message with clarity and precision.
